Project
Terra
An interactive climate atlas: a 3D globe, future scenarios and two decades of data.
Interactive dataWeb DesignWeb DevelopmentData Visualisation
Visit the live site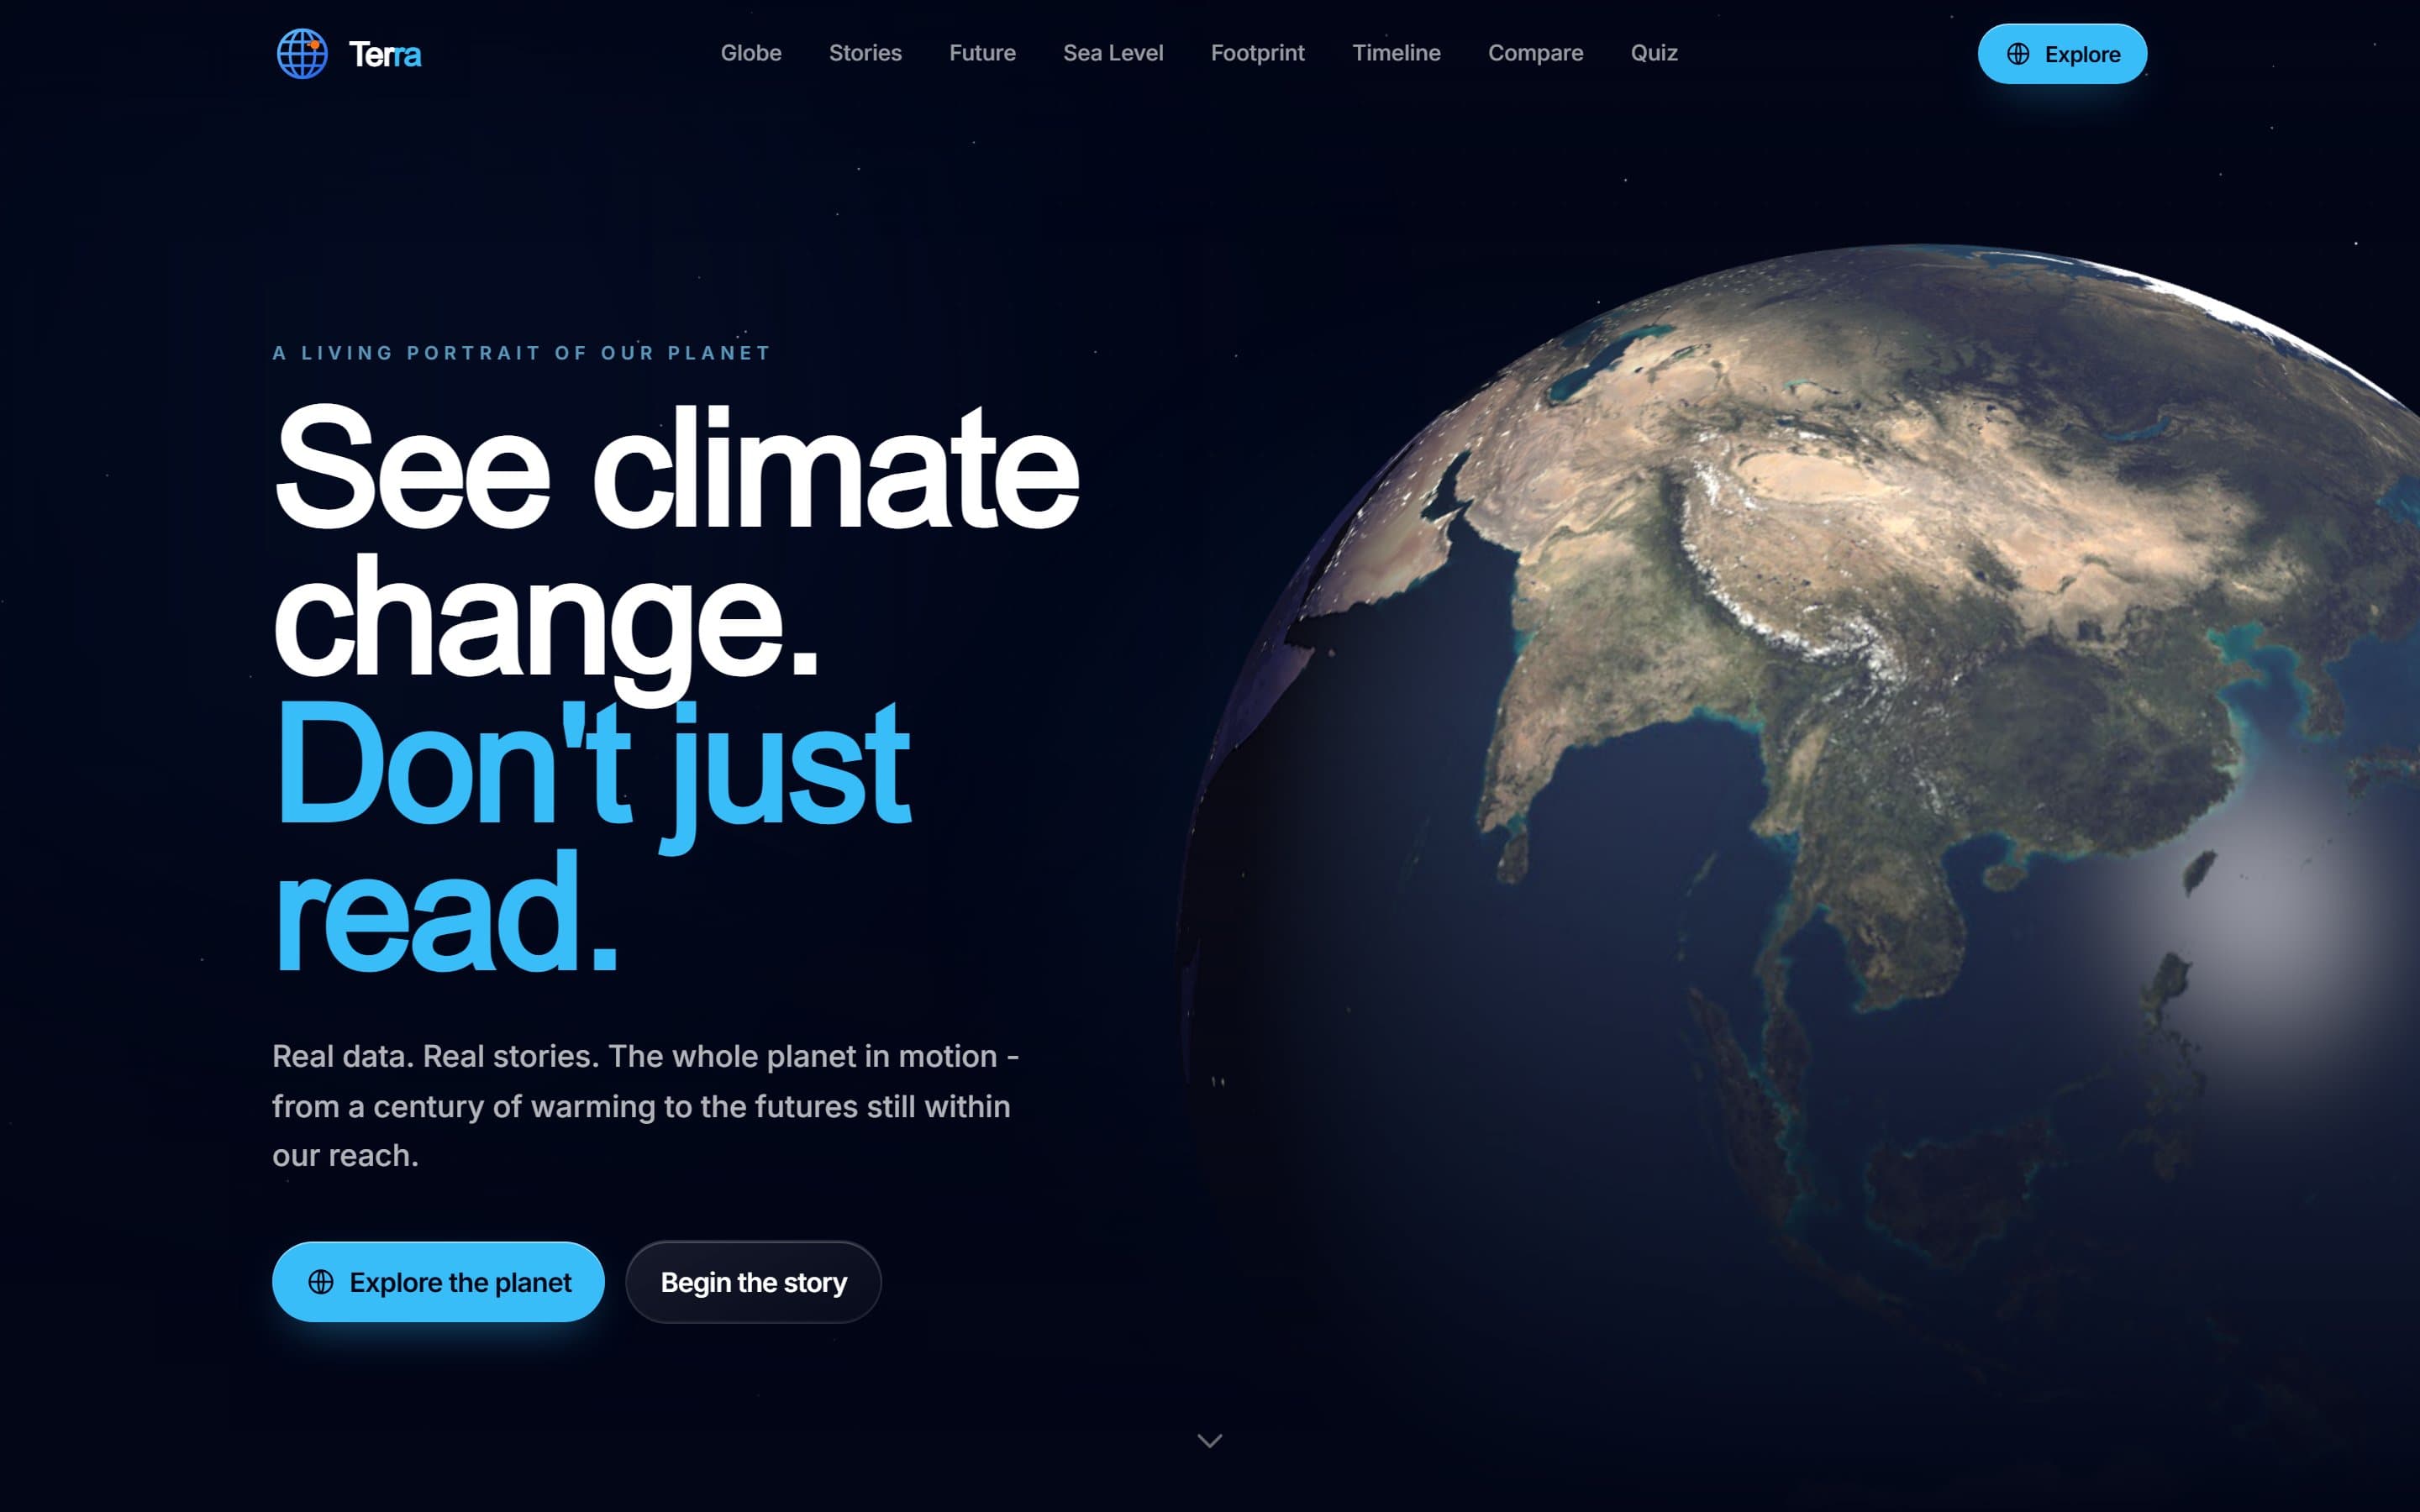
About this project
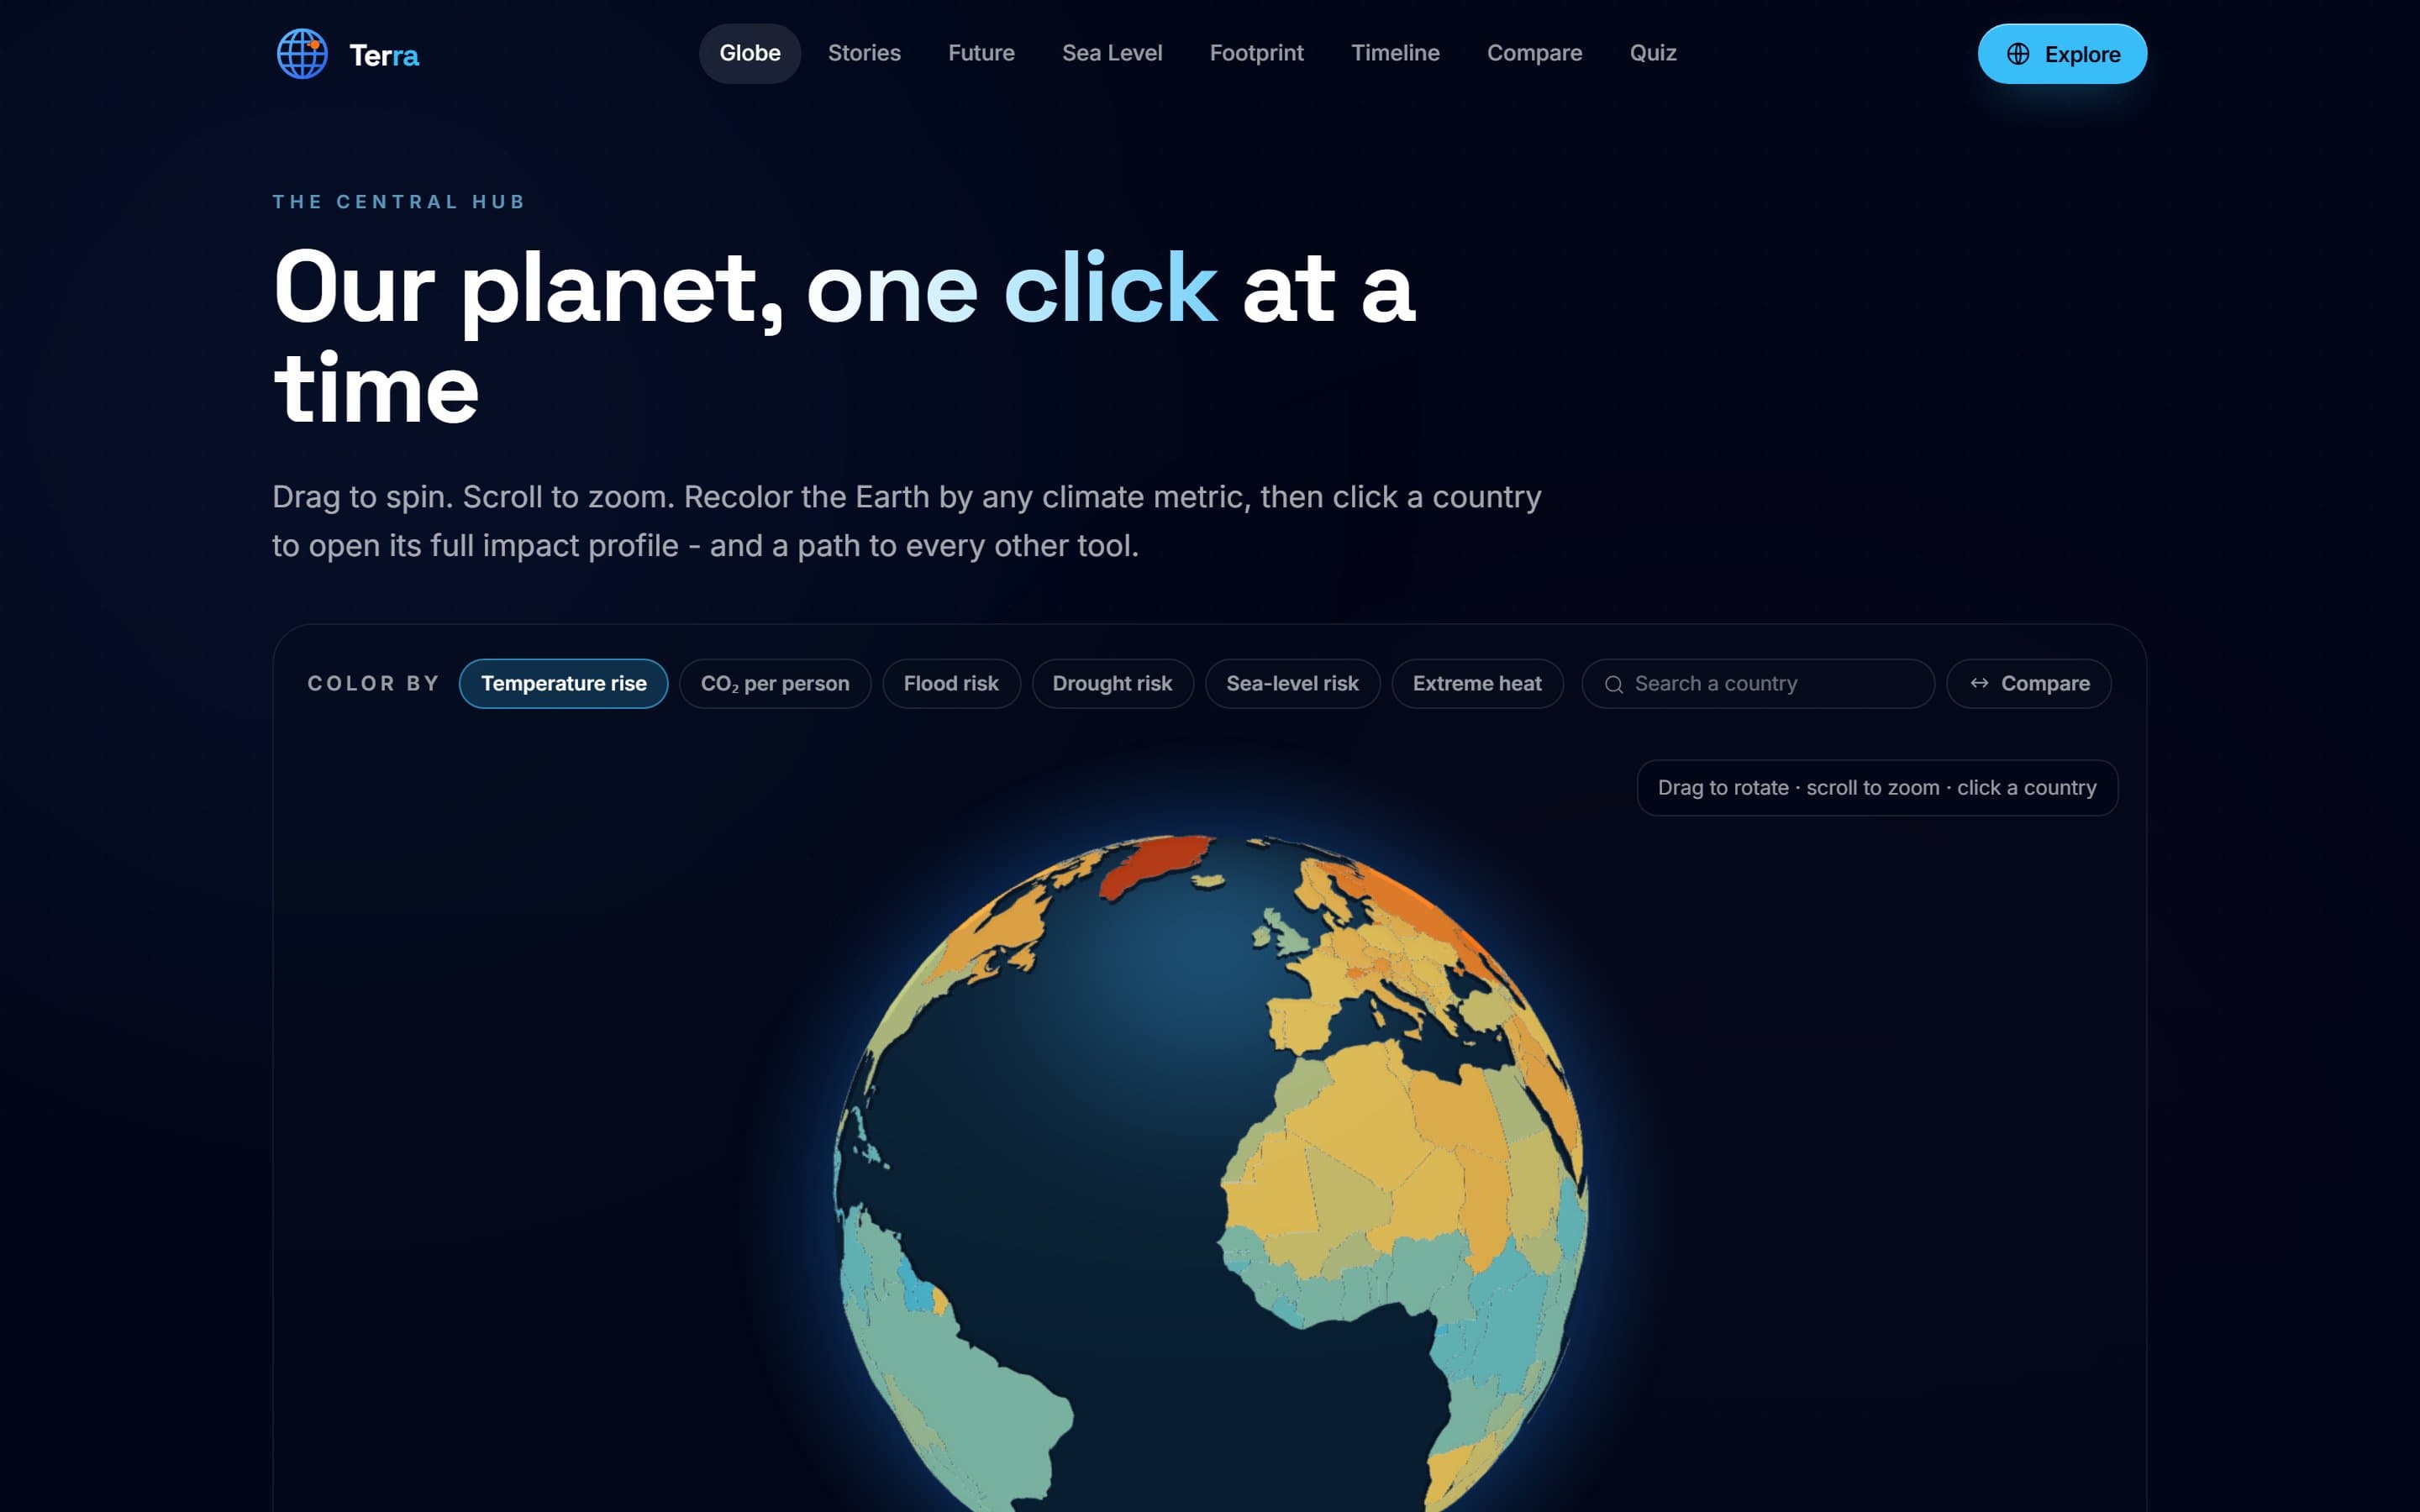
Terra is a studio project built to prove a point: the browser can make hard data feel physical. It's an interactive atlas of climate change, led by a 3D globe you can spin, recolour by temperature rise, CO₂, flood or drought risk, and click into any country.
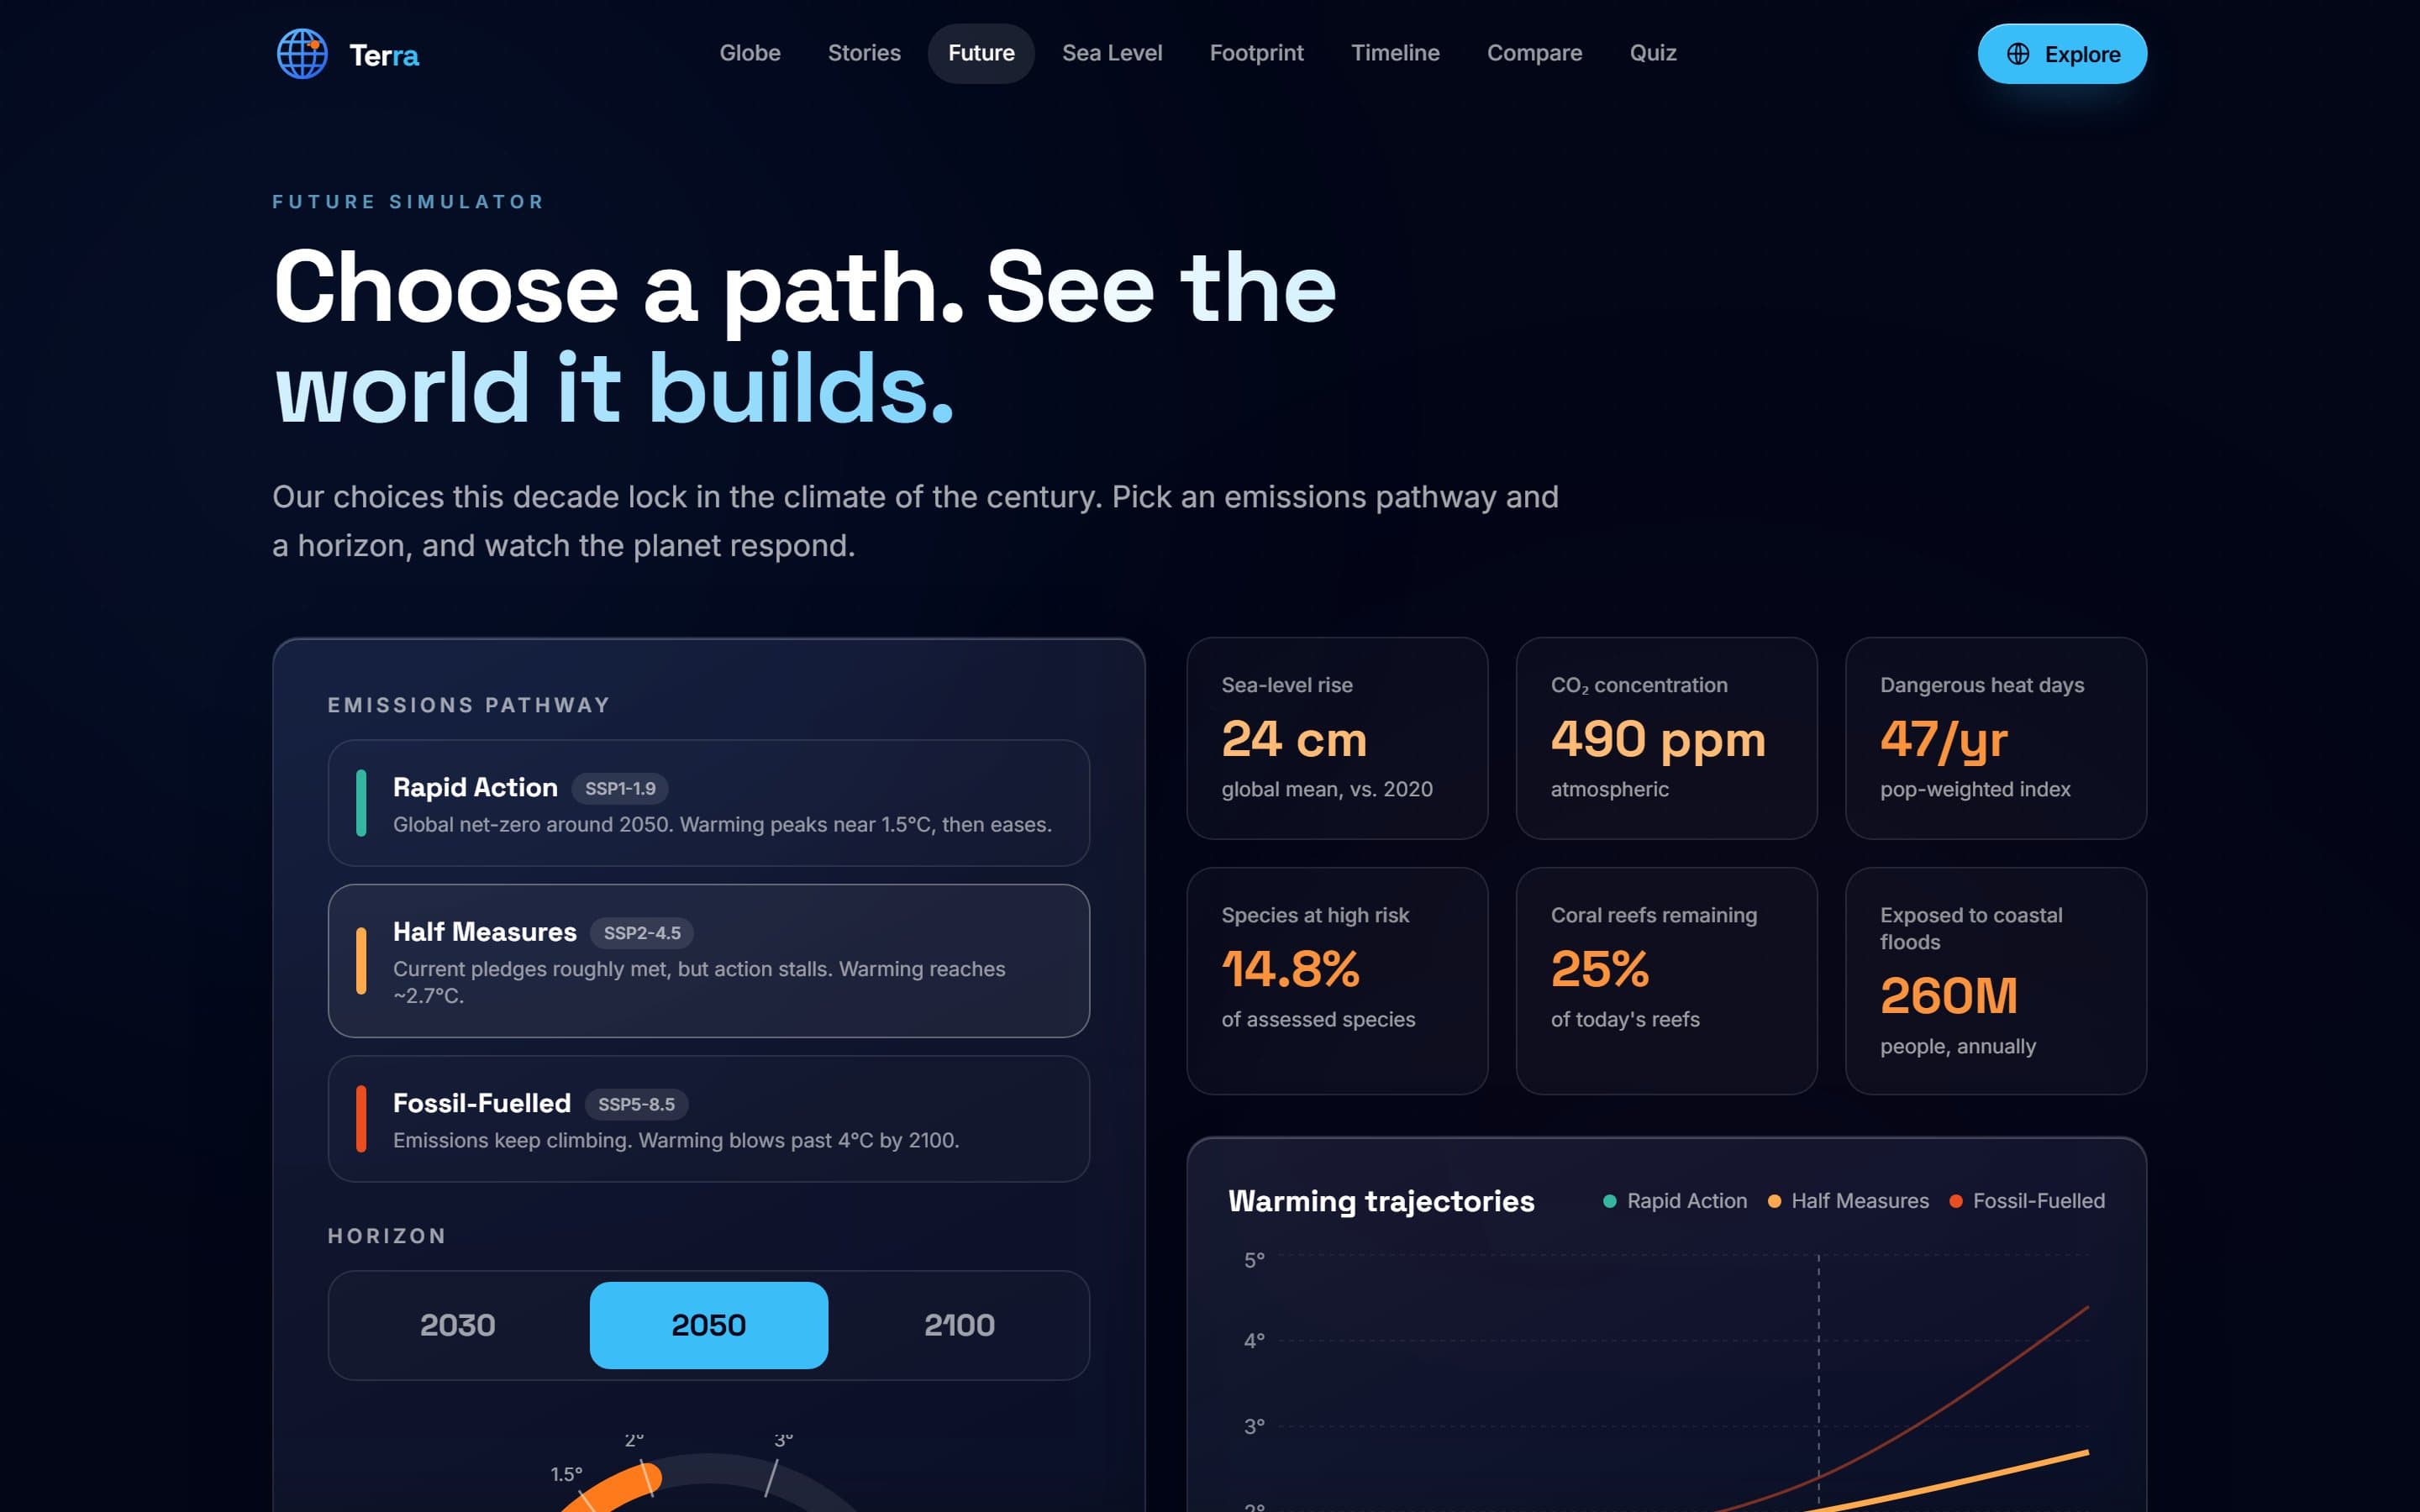
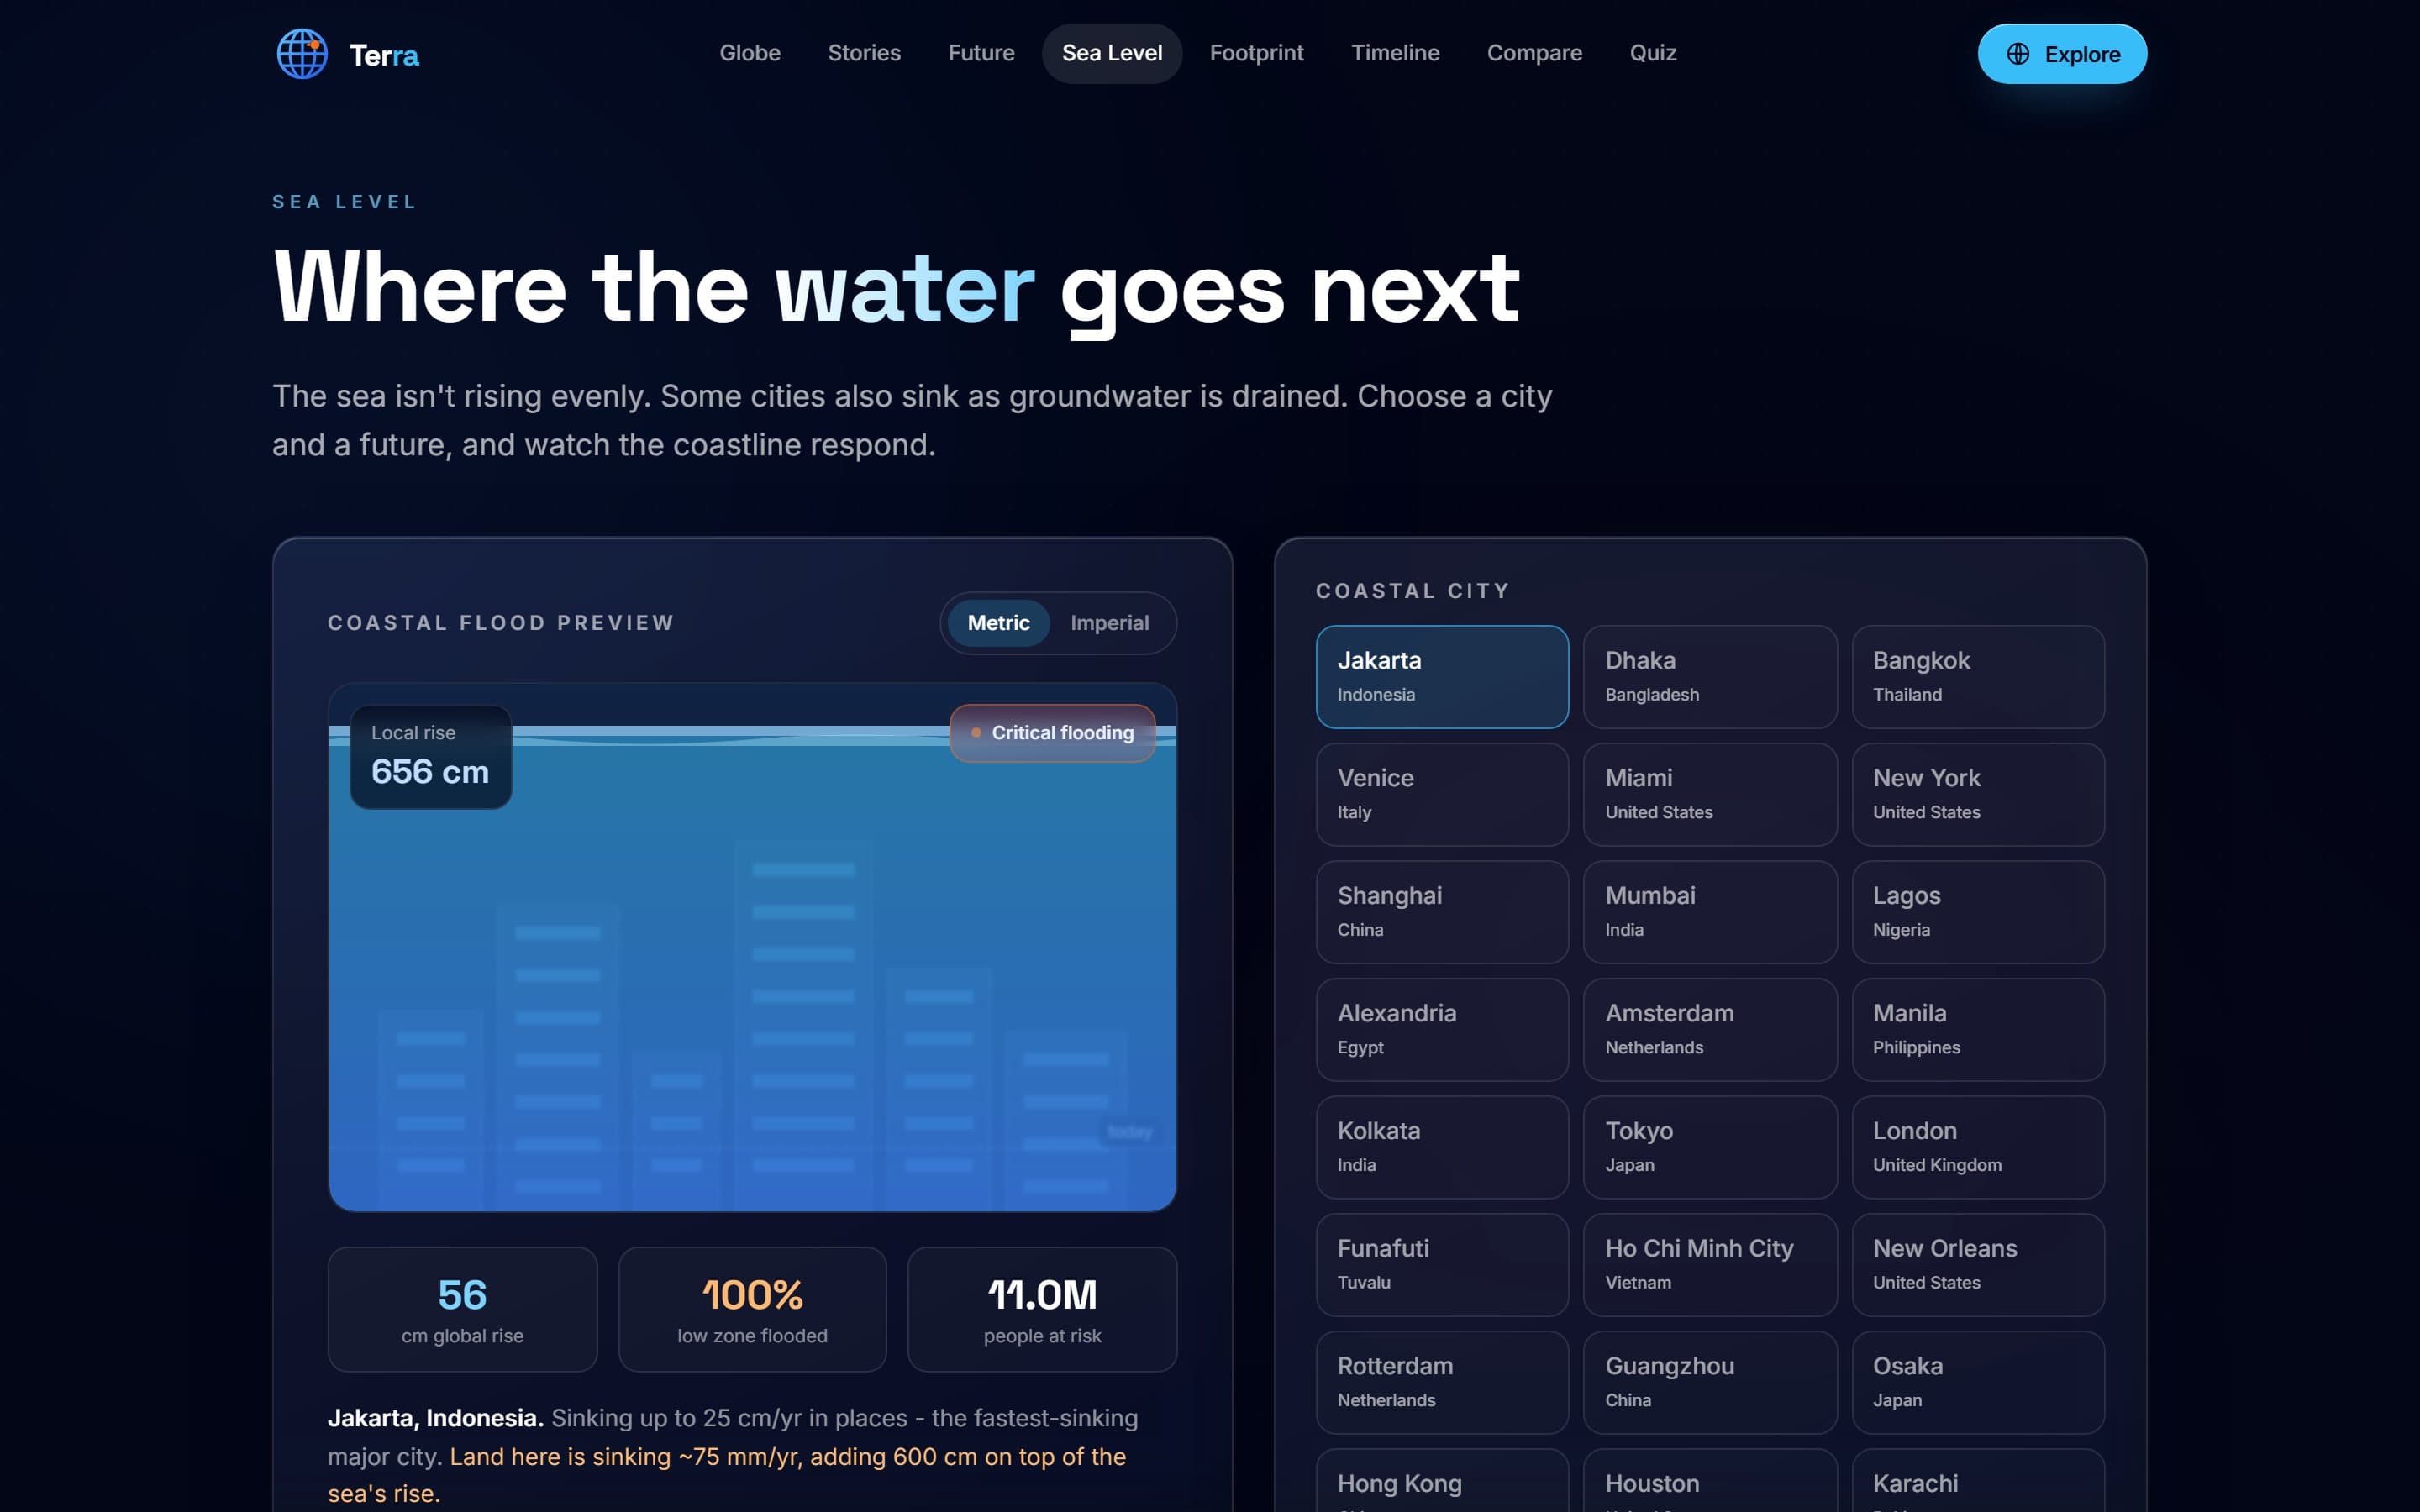
Around the globe sit seven more tools: case studies from the frontlines, a future simulator for 2030 to 2100, sea-level visualisations, a carbon footprint calculator, a disaster timeline, before-and-after comparisons and a quiz. Figures are synthesised from public datasets including IPCC AR6 and NASA GISTEMP.
What we built
- Interactive 3D globe, recolourable by six climate metrics
- Future simulator projecting 2030, 2050 and 2100
- Sea-level rise tool covering dozens of coastal cities
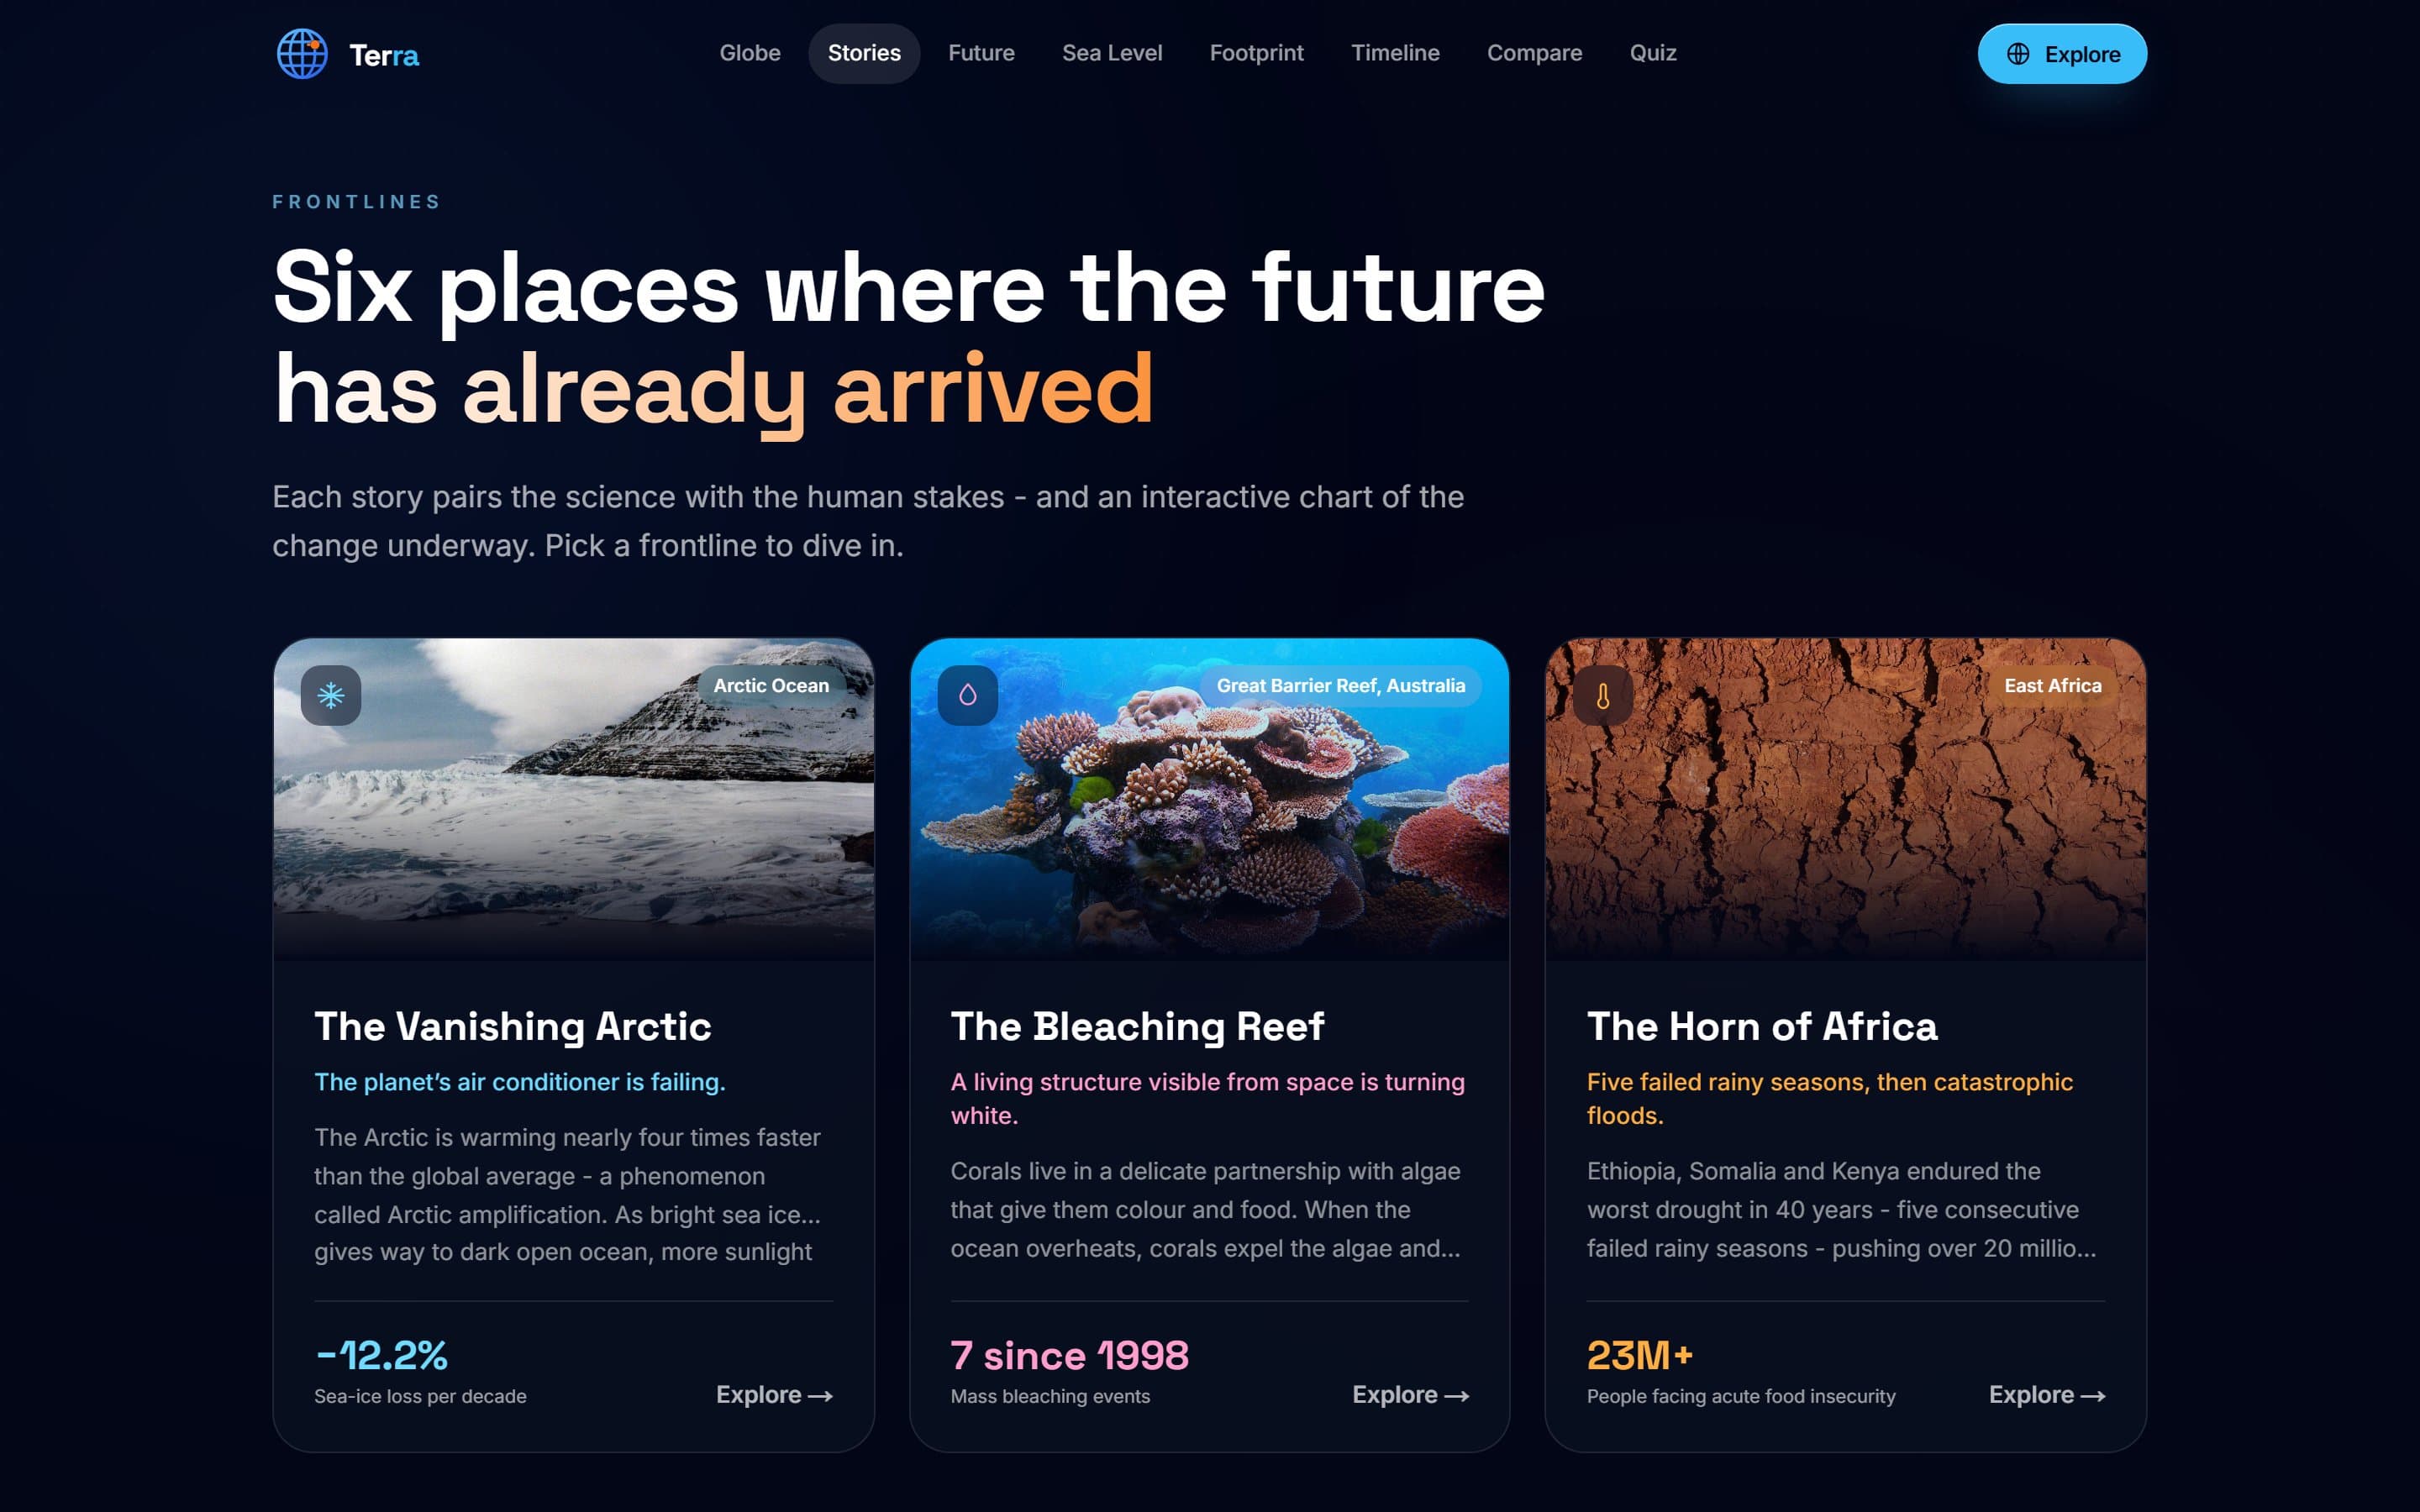
- Six interactive case studies from climate frontlines
- Carbon footprint calculator, disaster timeline and quiz
- A century of NASA GISTEMP data as an interactive stripe chart
More work
Ready when you are
Have a project in mind?
Tell us what you're making. We'll tell you honestly whether we're the right studio to make it with, and what it will take.